Running Grafana locally on HTTPS
I am currently developing a custom data-source for Grafana and needed to run the server in HTTPS mode in order to test out a rather odd use-case, this is just a quick post on how I did it - hopefully this saves you some time in the future.
Generating the certificates
Following the steps outlined here, I decided to spin up an Ubuntu Docker container for this, making sure to map the /home directory to a folder on my PC for easy access.
docker run -it --rm -v C:\docker-data\ubuntu:/home ubuntu
Once booted I installed openssh with the following command:
apt-get update && apt-get upgrade -y && apt-get install -y openssl
Once installed be sure to change to your home directory:
cd /home
Then run the below to generate a certificate for localhost:
openssl req -x509 -out localhost.crt -keyout localhost.key \
  -newkey rsa:2048 -nodes -sha256 \
  -subj '/CN=localhost' -extensions EXT -config <( \
   printf "[dn]\nCN=localhost\n[req]\ndistinguished_name = dn\n[EXT]\nsubjectAltName=DNS:localhost\nkeyUsage=digitalSignature\nextendedKeyUsage=serverAuth")
This should generate the following files in your mapped /home folder:
- localhost.crt
- localhost.key
Copy these files to somewhere where your Grafana server can access them.
Configure Grafana
In order to use the certificates you will need to make the following changes to your Grafana's defaults.ini file:
[server]
protocol = https
cert_file = D:\WRK\grafana-5.4.2\localhost.crt
cert_key = D:\WRK\grafana-5.4.2\localhost.key
Save and close the file - that's it from the Grafana side.
Trusting the certificate
If you were to browse to your server on https now - your browser would throw up an error page saying that the certificate is not valid \ trusted. We can solve this by importing the localhost.crt file into the computer's rusted Root Certification Authorities.
Note this is not recommended for production environments - but is the path of least resistance for us developers :)
- Open a Run dialog
- Enter in
mmcand click OK - Click File then Add/Remove Snap-in
- Select Certificates from the available snap-ins and click the Add > button
- Select Computer Account on the screen that appears and click Next >
- Ensure that Local Computer is selected on the next screen and click Finish
- Click OK to close the add snap-in dialog
- Using the left hand side panel navigate to Certificates -> Trusted Root Certification Authorities -> Certificates
- Right click on the Certificated folder and select All Tasks -> Import from the context menu
- On the Certificate Import Wizard screen click Next
- Browse for the and select your localhost.crt on the next screen, then click Next
- Leave everything as is on the next screen - click Next
- Review the pending changes and click Finish to import your certificate
If all goes well you should see a localhost certificate in the list:
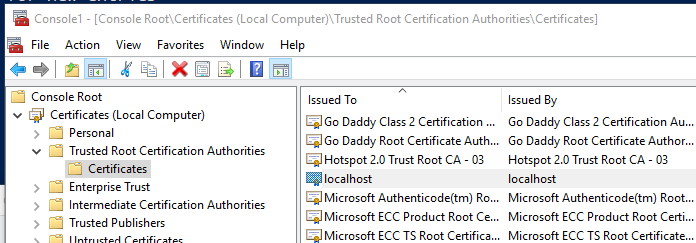
You're done with the import - you can now close the console.
Testing it all out
You can now navigate to your Grafana's server address on https (in my case that's https://localhost:3000/?orgId=1) - your browser should pick up the certificate and allow the connection as shown below:
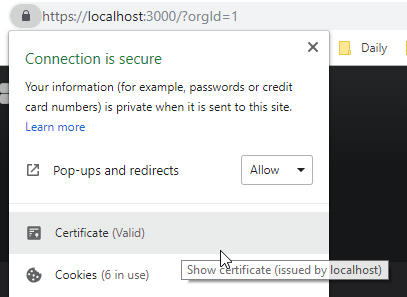
VIP: you may need to restart your browser as I know Chrome for a fact needs a restart to pick up changes to certificates - don't panic if it fails initially you probably just need to restart your browser.
You are done!