Monitoring your Unraid server with Telegraf and Grafana
Overview
In this post I will cover the process used to monitor your Unraid server using Telegraf, InfluxDB and Grafana.
I will be working off the assumption that you have already installed InfluxDB (v2) and Grafana on your server and focus on getting Telegraf installed and collecting data on your server.
Installing and configuring Telegraf
Generating telegraf.conf
Before deploying the container, open a terminal on your Unraid server and run the following commands making sure to adjust the paths for your server.
mkdir /mnt/user/appdata/telegraf/This will create a telegraf folder in Unraids default appdata location.
docker run --rm telegraf telegraf config > /mnt/user/appdata/telegraf/telegraf.confThis will pull the latest image of Telegraf from Docker, generate and save a configuration file to /mnt/user/appdata/telegraf/telegraf.conf on your server.
Configuring Telegraf
Once created, open up your telegraf.conf file and make the following changes.
Find the [[outputs.influxdb_v2]] section, uncomment it, and enter in your InfluxDB connection details. Once done it should look something like the below:
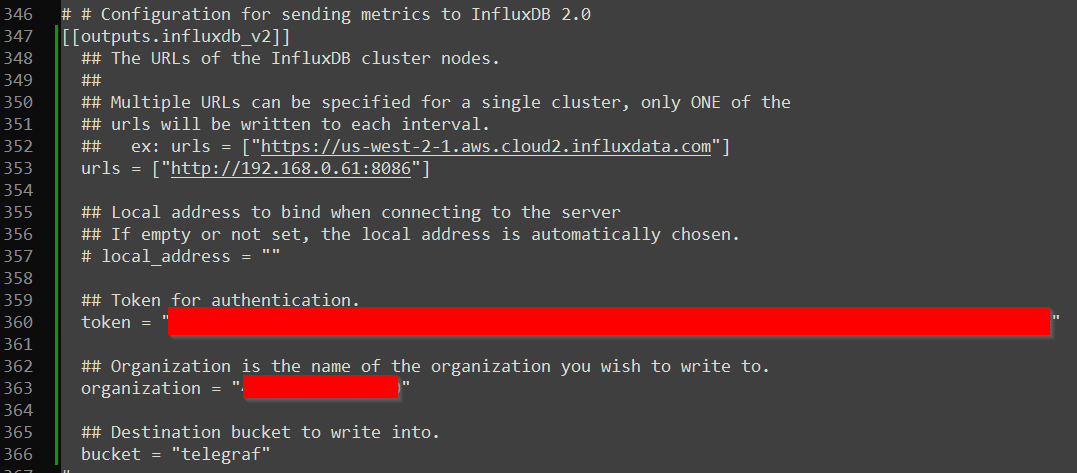
Optionally you can enable network monitoring by uncommenting the [[inputs.net]] section header.
Installing Telegraf
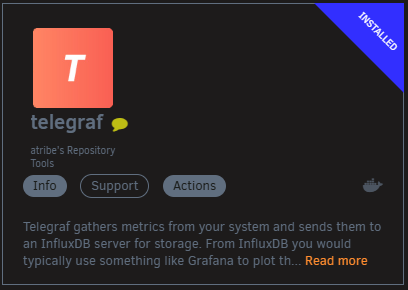
On your Unraid server, navigate to the Apps page and search for telegraf:
I found that the default configuration options for this container work well, however if you are a power user, or want to tweak some settings feel free to do so.
You should start to see metrics in InfluxDB a couple of seconds after deploying the container, however if you do not see anything I would suggest looking at the containers logs to help with troubleshooting.
InfluxDB Connection Information
Organization ID
The Organization ID can be found by clicking on your username, then about in the web interface.
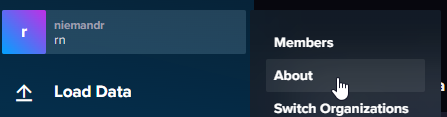
Under the Common IDs section, you should see it.
Token
I strongly suggest generating a token per system submitting data to InfluxDB as this reduces the attack surface should a token become compromised.
To generate a token in the web interface, click on the Load Data menu item, followed by selecting the API Tokens tab.
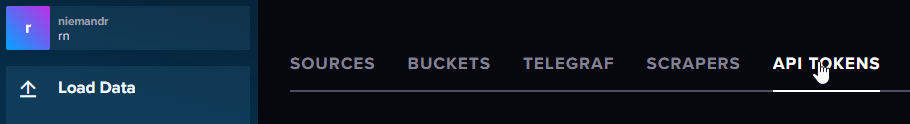
Click the Generate API Token button to generate a token for your server, making sure to note it down as you won’t be able to see it again.
Grafana Configuration
InfluxDB Datasource
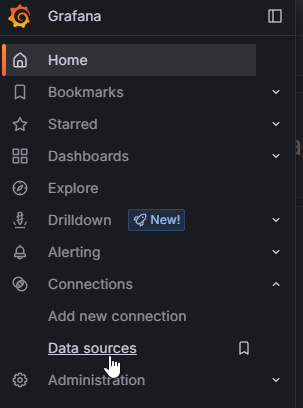
To add a data source to Grafana, click on the logo, then click on Data sources.
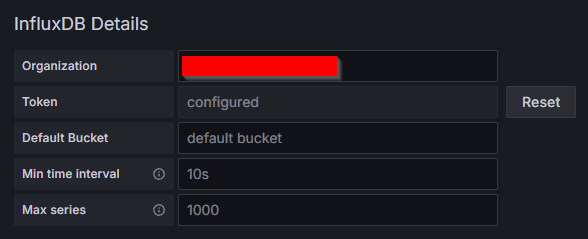
Find and add a new InfluxDB data source, switch the query language to Flux, and enter in the relative configuration for your InfluxDB server.
Ensure that you set the correct organization and token for the data source.
Create a test dashboard
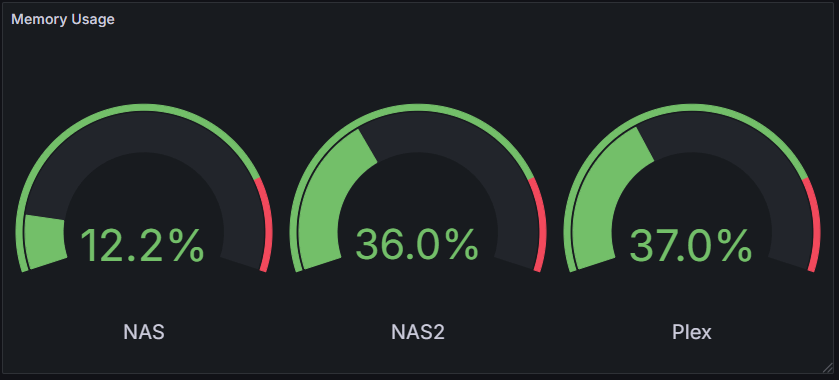
In Grafana, create a new dashboard, add a new guage backed by your InfluxDB datasource with the following query.
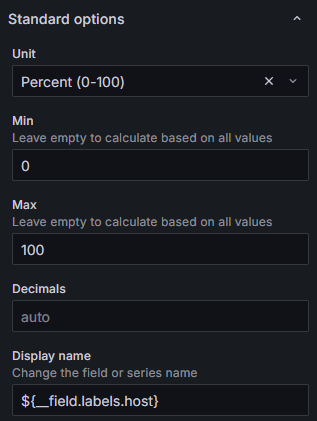
from(bucket: "telegraf") |> range(start: v.timeRangeStart, stop: v.timeRangeStop) |> filter(fn: (r) => r["_measurement"] == "mem") |> filter(fn: (r) => r["_field"] == "used_percent") |> aggregateWindow(every: v.windowPeriod, fn: last, createEmpty: false) |> yield(name: "last")Under the standard options section, set the unit to percentage, and use ${__field.labels.host} for the display name.
This should generate a gauge per unique telegraf input submitting data to your InfluxDB server.
That’s all there is to it!