Running InfluxDB 3 Core On Unraid
Quick Access
Overview
In this post I will cover the basics to get InfluxDB 3 Core up and running on Unraid, as I was unable to find a community application for this.
Container Deployment
InfluxDB 3 Core
Create a new Docker container in Unraid and configure it as shown below:
| Core | Name | influxdb3 | |
| Repository | influxdb:3-core | ||
| Mounts | /var/lib/influxdb3/data/ |
/mnt/user/appdata/influxdb/data/ |
|
/var/lib/influxdb3/plugins/ |
/mnt/user/appdata/influxdb/plugins/ |
||
| Ports | 8181 |
8181 |
|
| Variables | INFLUXDB3_DB_DIR |
/var/lib/influxdb3/data/ |
Must match the defined mount |
INFLUXDB3_OBJECT_STORE |
file | ||
INFLUXDB3_DATABASE_NAME |
rn | I am using rn as my database |
|
INFLUXDB3_PLUGIN_DIR |
/var/lib/influxdb3/plugins/ |
Must match the defined mount | |
INFLUXDB3_NODE_IDENTIFIER_PREFIX |
0 | ||
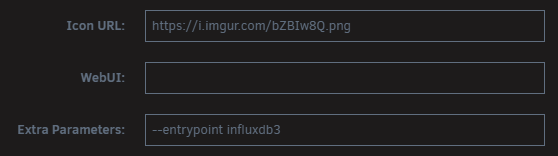
| Advanced | Extra Parameters | --entrypoint influxdb3 |
Needed to start InfluxDB |
| Icon URL | https://i.imgur.com/bZBIw8Q.png |
(Optional) icon to display in Unraid |
To configure the advanced options you will need to toggle the Advanced View toggle in the UI:
Create and start the container.
Generating an Admin Token
Before we can deploy the UI, we will need to generate an admin token to use.
To do this, launch an interactive console on your influxdb3 conatiner:
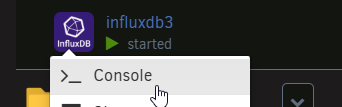
Issue the command below and take note of the token generated:
influxdb3 create token --adminEnsure that you save this somewhere safe.
InfluxDB 3 UI
To deploy the UI, create a new container using the following configuration.
| Core | Name | influxdb3-ui | |
| Repository | influxdata/influxdb3-ui | ||
| Mounts | /db/ |
/mnt/user/appdata/influxdb/ui/ |
Used to persist your configuration between container restarts |
| Ports | 80 |
8888 |
|
8888 |
8889 |
||
| Variables | DEFAULT_INFLUX_SERVER |
http://192.168.0.60:8181 |
The address and port defined for your influxdb3 container. |
DEFAULT_API_TOKEN |
xxx |
The token you just generated. | |
DEFAULT_SERVER_NAME |
NAS |
||
| Advanced | Post Arguments | --mode=admin |
Needed to start in admin mode |
| Icon URL | https://i.imgur.com/q9l1oct.png |
(Optional) icon to display in Unraid |
Deploy and start the container.
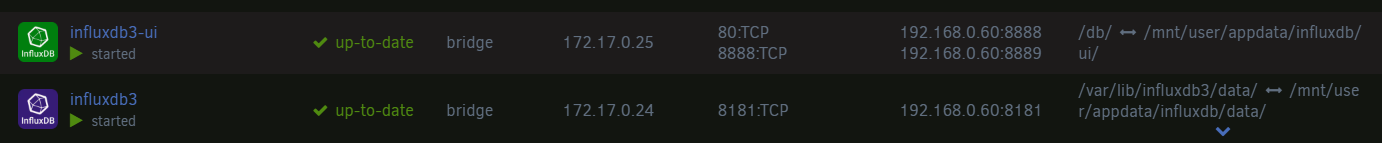
Deployment Overview
Once deployed your Unraid server should look something like this.
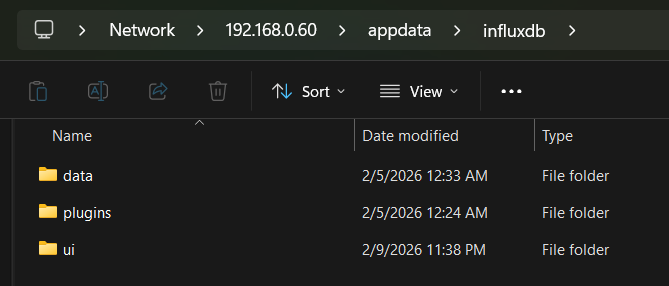
I personally store all my Docker container data in the appdata folder, like shown below:
At this point you should be able to navigate to http://<server>:<port> (e.g. http://192.168.0.60:8888) and see the UI.
Configuration
System Metrics
To ensure that everything is running as expected, and to get an idea of how your deployment is preforming, I would suggest installing the system metrics plugin.
Installation is as simple as enabling the plugin in the UI and following the prompts.
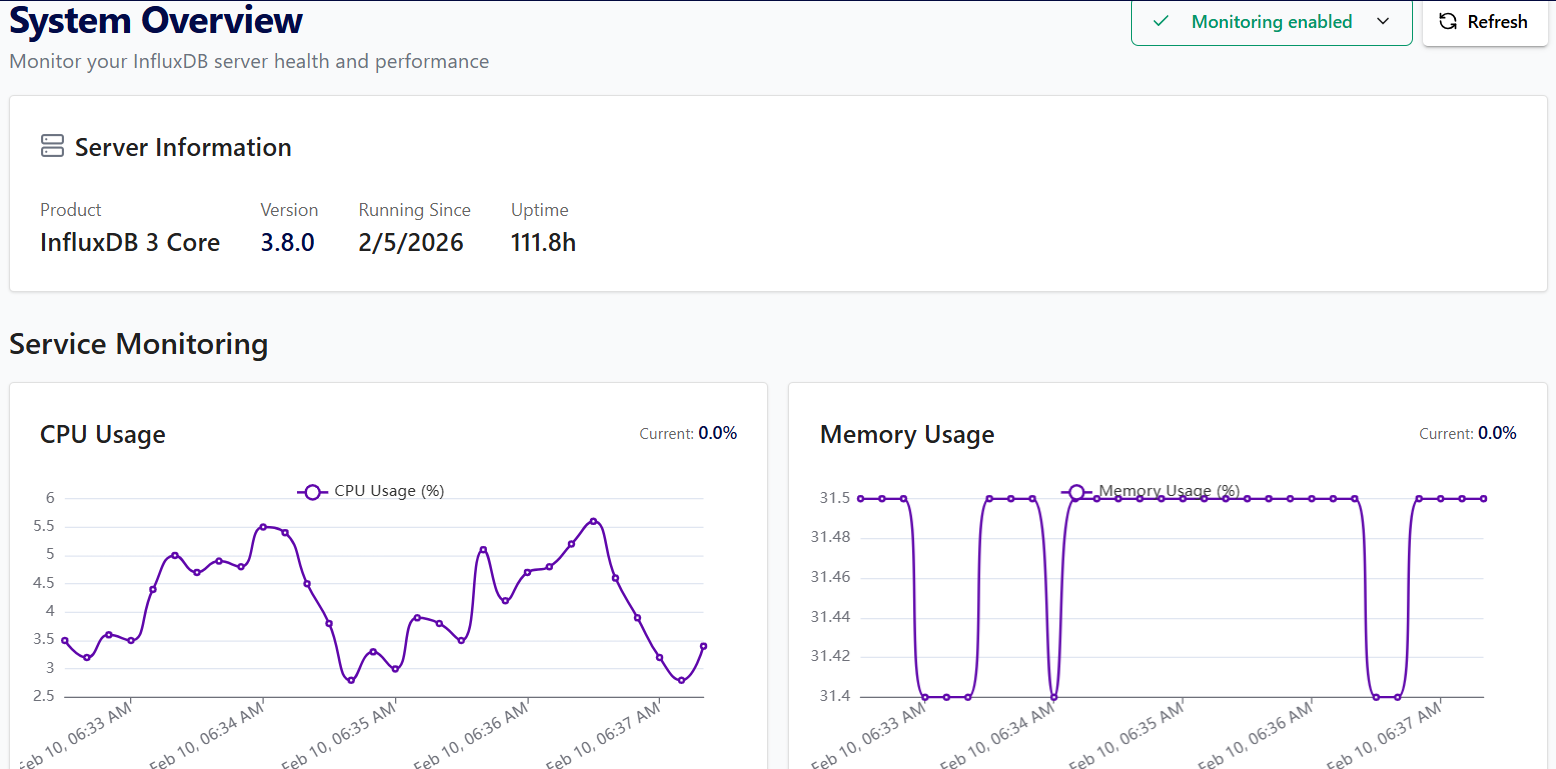
This will give you a good overview of your deployment, and also provide some data for us to query in the next step.
Grafana Data Source
Adding your InfluxDB server to Grafana is as simple as:
- Generating an access toke in the UI
- Configuring a new data source in Grafana using the below configuration
Name           : my-datasource
Query Language : SQL
URL            : http://192.168.0.60:8181
Database       : system-metrics
Token : xxxInsecure Connection option if you do not have SSL configured
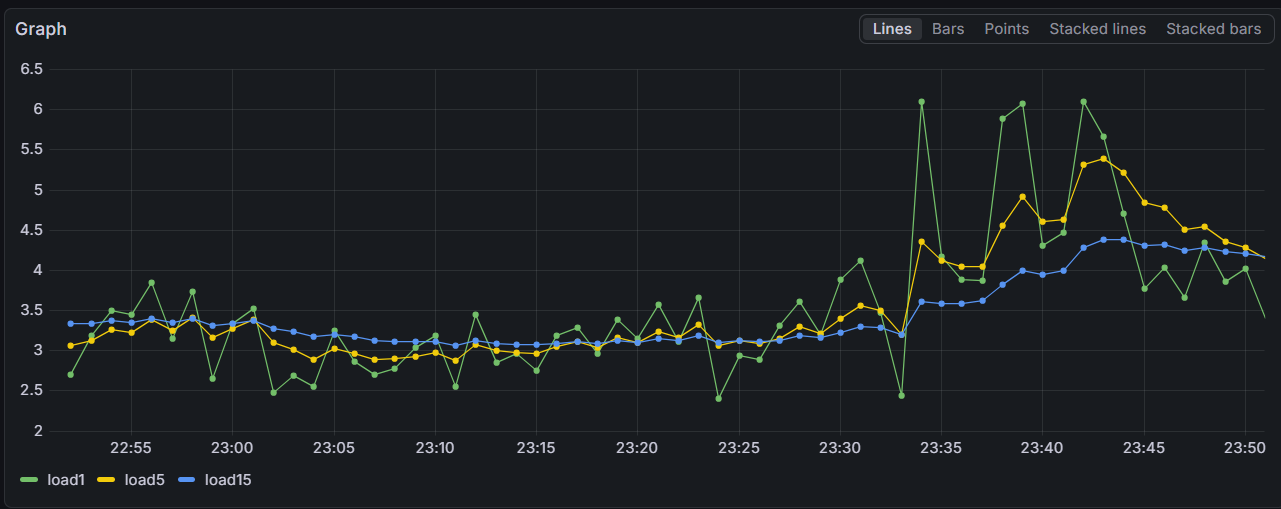
To ensure everything is working we can use the following test query...
SELECT time, load1, load5, load15
FROM system_cpu
WHERE time >= now() - interval '60 minutes'
... which should result in a graph similar to this.
In Closing
Hopefully you found this post useful, and I welcome all feedback!
Happy graphing!