Monitoring Host System with Home Assistant
Today I am going to be covering the system monitor sensor for Home Assistant, specifically how to use it to monitor the underlying host computer (or system). This component exposes CPU, disk, memory and network values to Home Assistant for monitoring and alerting.
Enabling monitoring
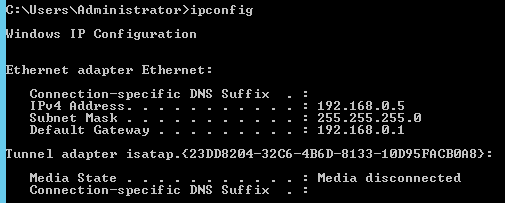
First we will need to enable the sensor in our config/sensor.yaml file. In order to monitor your network interface on a windows computer you will need to know the display name for your network adapter, you can get this value by running ipconfig in a command window, looking for the interface you want to monitor. The name of the interface will appear to the right of the Ethernet adapter (or wireless adapter) - in my case this is Ethernet.
1
2
3
4
5
6
7
8
9
10
11
12
13
14
15
16
17
18
19
20
21
22
23
24
25
26
- platform: systemmonitor
  resources:
    - type: memory_use_percent
    - type: processor_use
    - type: last_boot
    - type: network_in
      arg: 'Ethernet'
    - type: network_out
      arg: 'Ethernet'
    - type: packets_in
      arg: 'Ethernet'
    - type: packets_out
      arg: 'Ethernet'
    - type: disk_use_percent
      arg: "M:\\"
    - type: disk_use_percent
      arg: "N:\\"
    - type: disk_use_percent
      arg: "O:\\"
    - type: disk_use_percent
      arg: "P:\\"
    - type: disk_use_percent
      arg: "C:\\"
    - type: disk_use_percent
      arg: "I:\\"
    - type: memory_free
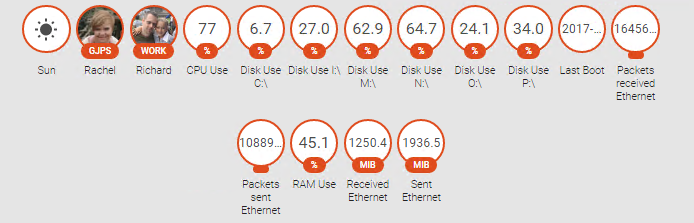
As you can see from above, I am going to be monitoring a lot of resources, after restarting Home Assistant all my new resources appear at the top of the Home view.
Grouping entities
I much prefer the cards display (called groups) over the default icons as it allows me to control the grouping and ordering of these objects. In order to create a group we will need to know the entity_id’s for the targeted objects, we can get these from the state view https://:8123/dev-state my new objects are:
- sensor.cpu_use
- sensor.diskusec
- sensor.diskusei
- sensor.diskusem
- sensor.diskusen
- sensor.diskuseo
- sensor.diskusep
- sensor.last_boot
- sensor.packetsreceivedethernet
- sensor.packetssentethernet
- sensor.ram_use
- sensor.received_ethernet
- sensor.sent_ethernet
- sensor.ram_free
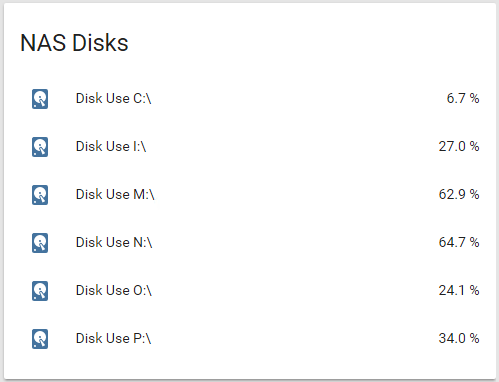
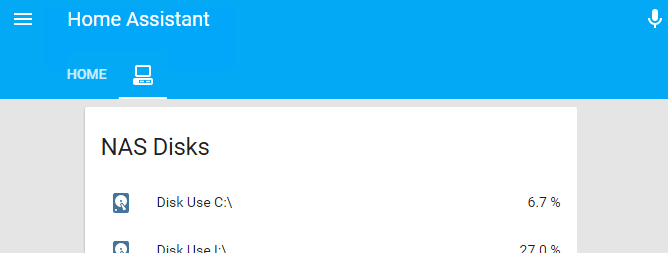
Let’s start off by grouping all my hard drives together, to do this I will need to create a new group and add all the entities we want to include. In my config/groups.yaml file I added the following group:
1
2
3
4
5
6
7
8
9
host_drives_group:
  name: NAS Disks
  entities:
    - sensor.disk_use_c
    - sensor.disk_use_i
    - sensor.disk_use_m
    - sensor.disk_use_n
    - sensor.disk_use_o
    - sensor.disk_use_p
After restarting Home Assistant my new group exists:
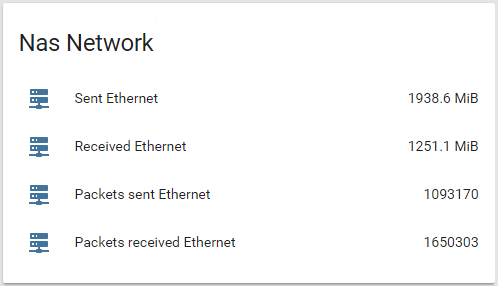
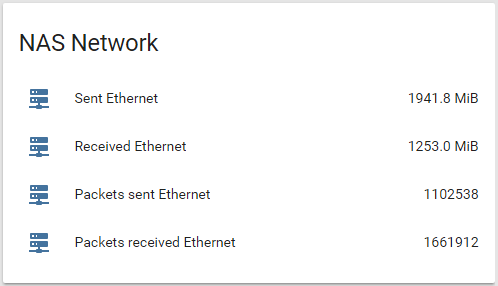
I used the same flow to create my Nas Network group:
1
2
3
4
5
6
7
host_network_overview:
  name: NAS Network
  entities:
    - sensor.sent_ethernet
    - sensor.received_ethernet
    - sensor.packets_sent_ethernet
    - sensor.packets_received_ethernet
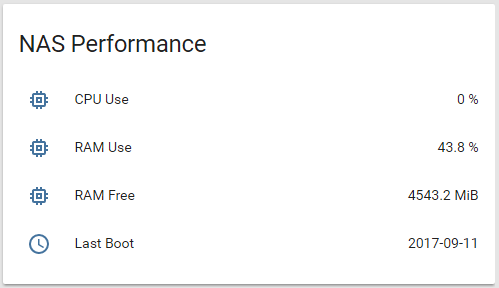
And finally one more last time to create my NAS Performance group:
1
2
3
4
5
6
7
host_performance_group:
  name: NAS Performance
  entities:
    - sensor.cpu_use
    - sensor.ram_use
    - sensor.ram_free
    - sensor.last_boot
Creating views
Lastly I would like to create a view (basically a tab on the top of the Home Assistant’s UI) to display everything performance monitoring related. Views are a nice way to group together similar components and provide an uncluttered view into your home automation when compared to the default home view. View are basically groups with the view: yes attribute set, and are declared using the same syntax, i.e. we will need to know what we would like to display, in my case that was:
- group.hostdrivesgroup
- group.hostnetworkoverview
- group.hostperformancegroup
You can use any material design icon to replace the default icons used by Home Assistant (provided you prefix them with mdi:), so for my view I am going to be using the desktop-classic icon:
1
2
3
4
5
6
7
8
host_overview_view:
  name: NAS Overview
  view: yes
  icon: mdi:desktop-classic
  entities:
    - group.host_network_overview
    - group.host_drives_group
    - group.host_performance_group
Restart Home Assistance and my new view appears!
Customising icons
Just like with the views, any displayed entity on Home Assistants user interface can be customized, and have its default icon replaced with a new one. Unlike views and groups though, you need to make these customizations under the homeassistant root configuration property using the customize: attribute. To keep things simple I prefer to break these customizations out into their own file (config/customize.yaml) and reference them in as shown below:
1
2
3
homeassistant:
  ...
  customize: !include config/customize.yaml
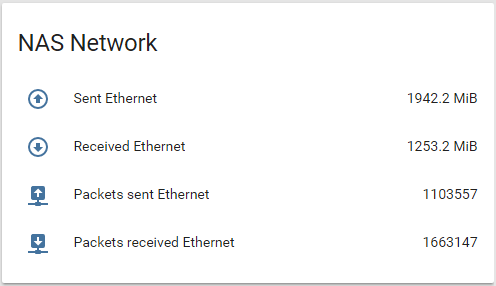
For now I would like to change the icons for the NAS Network card:
In config/customize.yaml I added the following:
1
2
3
4
5
6
7
8
sensor.packets_sent_ethernet:
  icon: mdi:upload-network
sensor.packets_received_ethernet:
  icon: mdi:download-network
sensor.received_ethernet:
  icon: mdi:arrow-down-bold-circle-outline
sensor.sent_ethernet:
  icon: mdi:arrow-up-bold-circle-outline
After restarting Home Assistant my changes were visible. Note you can customize a lot more than just the icon of an entity (full documentation here), and as a result can produce some pretty interesting ways of displaying your data.
That’s all for now, hopefully you found this post interesting and I look forward to any comments / suggestions below.